

- Salesforce Consulting Services
A VP of Sales opens the pipeline dashboard on Monday and sees $4.2M. RevOps runs the saved pipeline report an hour later and gets $3.8M. Finance walks into the forecast meeting carrying $3.1M.
All 3 numbers came out of the same Salesforce org. All 3 are arithmetically correct.
They disagree because they answer different questions, or because different people ran them, or because one of them was calculated at a different moment and nobody refreshed it. The instinct in that meeting is to rebuild the report until it matches. That buries the cause and guarantees the same argument returns next quarter.
Four details settle most of these disputes before anyone opens report builder: which number differs and by how much, which report or dashboard produced it, which user was logged in at the time, and which date basis people expected. Write those down first. Teams that skip this step end up debugging a report that was never the problem.
This guide walks through every layer where Salesforce Reports go wrong, in roughly the order VALiNTRY360 works through them during an org assessment: report logic, user access, source records, refresh state, and the historical question hiding behind the metric.
What Makes A Salesforce Report Trustworthy
Trust in a report has nothing to do with whether the number feels right. It has to do with whether anyone can explain how the number was produced, in front of people who disagree with it.
Five conditions have to hold at once. Break any one of them and the report stops being evidence.
Trust Condition | Question To Answer |
|---|---|
Source records | Are the underlying records complete and current? |
Report logic | Does the report measure the intended population? |
Visibility | Can the viewer access the expected records and fields? |
Time context | Is the result current, and based on the correct period? |
Metric definition | Does every team mean the same thing by the KPI? |
A trustworthy report also survives a trace. Someone should be able to follow the total back to the records it included, the records it excluded, the calculation applied to them, and the business definition everyone signed off on. If you can’t walk a skeptical CFO through those 4 in under 10 minutes, the number isn’t yet defensible.
Orgs tend to find this out in the wrong order. A report gets built during implementation, published to a folder, and quoted in leadership decks for a year or more before anyone checks it against the system of record. By then the definition has drifted, 3 teams have cloned the report, and the original owner has left.
How To Diagnose A Reporting Discrepancy
The symptom tells you which layer to inspect. Start here rather than opening report builder, because the fastest way to make a reporting dispute permanent is to rebuild the report before anyone knows why it disagreed.
Symptom | First Place To Check |
|---|---|
2 users see different totals in the same saved report | Sharing, field-level security, ownership, role assignment |
2 reports covering the same KPI disagree | Report type, filters, date basis, formulas |
Everyone sees the same suspicious number | Source records and KPI definition |
Dashboard differs from its source report | Refresh status, active dashboard filter, running user |
Count is unexpectedly high | Row grain, parent-child rows, duplicates |
Records are missing | Report type, object relationship, filters, access |
An older pipeline value can’t be recreated | Historical tracking method |
Salesforce and Finance disagree | Metric definition, currency, system of record |
Reproduce Before You Investigate
Get the exact report, the exact filter values, and the exact user. A discrepancy that can’t be reproduced is usually 2 people describing 2 different reports while believing they’re looking at one. This happens more often than any technical cause on this page, and it costs nothing to rule out.
Record The Context Around The Number
Note who ran the report, when they ran it, which filter values were active, and whether the number came from a dashboard or the report itself. A pipeline figure quoted from a dashboard on Thursday and a report on Friday can differ for 4 unrelated reasons, and you can’t tell them apart without this.
Trace The Population Before The Total
Before checking any sum, establish what one row represents and how many rows the report returned. Most arguments about a total are really arguments about a population, and the total was never the disputed part.
Reconcile A Known Sample
Pick 10 records whose correct treatment you can verify by hand, then follow each one into the report. If 3 of them never appear, you have located your layer without touching a single filter. This is the step teams skip, and it’s the one that ends the argument.
How Report Types And Object Relationships Change Your Results
The report type is the quietest failure in Salesforce Reporting because it does its damage before filters, formulas, or permissions ever run. It decides which records are eligible to appear at all.
Start With The Primary Object
Every report type sets a primary object and the related objects reachable through defined relationships. When a field can’t be found in report builder, the usual cause is a report type that doesn’t expose that relationship, rather than missing data. Admins lose hours searching for a field that was never available on that report type in the first place.
Check Required Relationships
Salesforce documentation gives the clearest example. In an Opportunities with Contact Roles report, any opportunity without a contact role doesn’t appear.
So a rep can have a valid $400K opportunity, correctly staged and correctly dated, and it stays invisible in that report because nobody added a contact role.
The same trap appears when someone adds a field from a child object to an existing report. Adding that column can drop every row with no related record. The report was right on Tuesday and wrong on Wednesday, and the only change was a column that looked purely cosmetic.
A subtler version catches experienced admins. Run an Opportunities with Products report and select no Product or Price Book fields, and Salesforce treats it as a plain Opportunities report. The behavior shifts underneath you based on which columns are selected.
Check The Row Grain
Ask one question before trusting any count: what does 1 row represent? An account, an opportunity, a contact role, or a relationship record?
In a parent-child report, one account with 5 contacts produces 5 rows, and the record count reads 5. Anyone reading that as 5 accounts has overstated the customer base by 400%.
Record Count in Salesforce counts rows, so the figure only matches your business entities when the report has no child object attached. Reports built by Salesforce customization and automation work carry the same risk whenever a relationship is added to an existing report type.
Review With And Without Behavior
Custom report types built on WITH or WITHOUT relationships behave in a way that reads incorrectly at a glance. Filter on a child field and Salesforce can still return primary records whose child records fail that filter, with the child columns rendering as dashes.
Someone scanning the report sees rows they believe they filtered out. What appears on screen is accurate and the report is working. The relationship logic simply behaves differently from what they assumed when they wrote the filter.
How Filters, Dates, And Formulas Change A Report Total
Two reports can both be correct and still disagree by 30%. This is where that gap usually opens, and it’s the layer most often blamed on dirty data when configuration is the real cause.
Check The Standard Filters First
Start with Show Me. My opportunities, my team’s opportunities, and all opportunities produce 3 different numbers from an identical report definition, and the setting sits in a spot that’s easy to scroll past.
Then check the primary date filter and its range. When no records fall inside the defined reporting timeframe, the report returns nothing and looks broken rather than empty.
Check Field Filters And Filter Logic
Cross filters, nested AND and OR logic, and exclusion filters all reshape the population without changing the report type, which is why 2 reports on the same object can diverge so far.
Relative date filters deserve a second look. Last quarter on a fiscal calendar and last quarter on a standard calendar are different date ranges, and a report saved by someone in a different fiscal setup carries that difference silently into every future run.
Define The Date Behind The KPI
This is the single most common reason 2 correct reports disagree, and it has no technical fix.
A Q3 bookings report filtered on Close Date measures deals that closed. A Q3 pipeline creation report filtered on Created Date measures deals that were born.
Both are Q3 numbers. Neither is wrong. They count different events.
Add a custom contract date or activation date and there are now 3 defensible answers to what the business did in Q3. Finance picks one, Sales picks another, and the meeting runs 20 minutes over. Teams running Sales Cloud pipeline reporting hit this every quarter close.
Review Formula Behavior
Salesforce formulas carry limits that change results rather than throwing visible errors, which makes them dangerous in a report that goes unaudited.
Blank report cells are treated as zero inside formulas. An average across 200 opportunities where 60 carry a blank amount isn’t the average of the 140 real values, and nothing on screen says so.
A summary formula can’t reference another summary formula, and it can’t reference a row-level formula. Report data also can’t be grouped or filtered by a summary formula column, which pushes admins toward workarounds that introduce fresh errors. Visible failures are rarer and easier to catch, appearing as an error on divide-by-zero or when a summary field exceeds 21 digits.
How Multi-Currency Settings Shift Reported Amounts
Multi-currency orgs carry a set of behaviors that break reconciliation between Salesforce and finance, and none of them involve anyone entering bad data.
Close Date Drives Converted Amounts
Converted opportunity amounts are calculated from the specified Close Date. Move a close date into a different exchange-rate period and the converted amount changes, even though the deal value was never edited.
A rep pushing a close date by 2 weeks can move the reported number. Nothing in the audit trail flags this as a value change, because technically it wasn’t one.
Conversion Runs In Two Steps
The record currency converts to corporate currency first, then converts again to the running user’s personal currency. Outdated rates compound across both hops.
So 2 users with different personal currencies can see amounts that reconcile neither to each other nor to the finance system, from a report that’s working exactly as designed.
Dated Rates Have A Narrow Scope
Dated exchange rates apply to opportunities and opportunity-related objects. They aren’t used in forecasting, in currency fields on other objects, or in other report types. That scope gap is why a currency field on a custom object refuses to match the opportunity it was derived from.
One more constraint catches people mid-build: with multiple currencies enabled, field-to-field filters in reports don’t support currency fields such as Amount at all. Orgs running consolidated reporting across systems usually solve this at the data strategy and architecture layer rather than inside report builder.
How Multi-Currency Settings Shift Reported Amounts
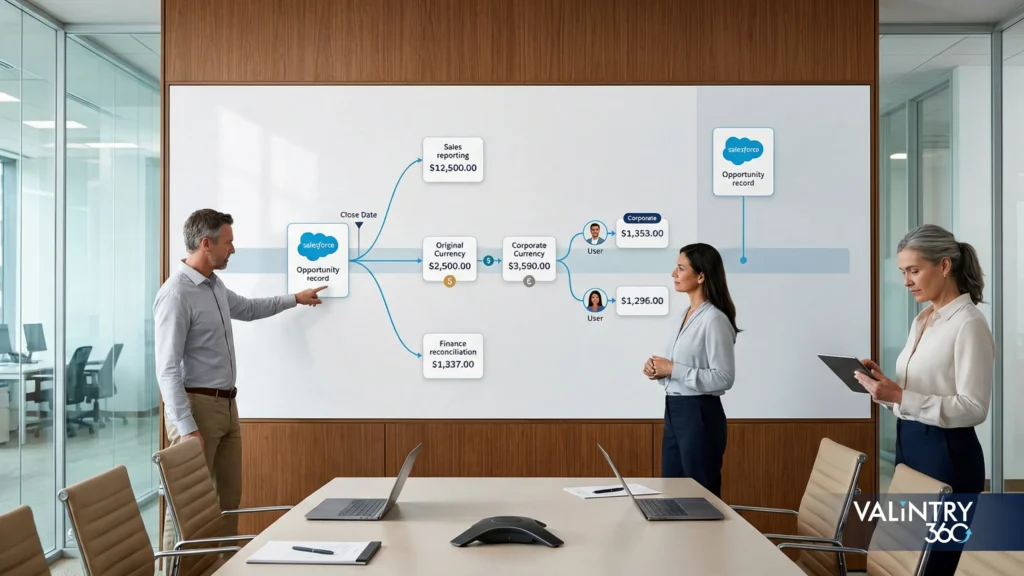
Multi-currency orgs carry a set of behaviors that break reconciliation between Salesforce and finance, and none of them involve anyone entering bad data.
Close Date Drives Converted Amounts
Converted opportunity amounts are calculated from the specified Close Date. Move a close date into a different exchange-rate period and the converted amount changes, even though the deal value was never edited.
A rep pushing a close date by 2 weeks can move the reported number. Nothing in the audit trail flags this as a value change, because technically it wasn’t one.
Conversion Runs In Two Steps
The record currency converts to corporate currency first, then converts again to the running user’s personal currency. Outdated rates compound across both hops.
So 2 users with different personal currencies can see amounts that reconcile neither to each other nor to the finance system, from a report that’s working exactly as designed.
Dated Rates Have A Narrow Scope
Dated exchange rates apply to opportunities and opportunity-related objects. They aren’t used in forecasting, in currency fields on other objects, or in other report types. That scope gap is why a currency field on a custom object refuses to match the opportunity it was derived from.
One more constraint catches people mid-build: with multiple currencies enabled, field-to-field filters in reports don’t support currency fields such as Amount at all. Orgs running consolidated reporting across systems usually solve this at the data strategy and architecture layer rather than inside report builder.
How Permissions And Sharing Split One Report Into Many
When 2 people run an identical saved report and get different totals, stop looking at the report. The report is fine. Something about the 2 viewers isn’t the same.
Record Visibility
Ownership, role hierarchy, sharing rules, teams, and manual sharing all decide which records a given user can see. A regional manager and a global VP running the same pipeline report should get different numbers, and that rarely surprises anyone.
The surprises live in the edge cases. Opportunity and Activity reports rely on the role or territory hierarchy to determine accessible records, so a user with no Role assigned won’t see their own records in those reports. This catches new hires, contractors, and integration users constantly, and it applies to system administrators too.
A second one trips up experienced admins: reports built on a custom report type don’t follow the sharing rules on the Opportunity and Activity objects. A custom report type can therefore surface records the standard report type would have hidden from that same user.
Field Access
Field-level security does more than blank out a column. A report filter referencing a field the viewer can’t access can invalidate the filter logic entirely, and dashboard filters or groupings built on inaccessible fields can vanish after a refresh.
The viewer sees a component that looks intact and reports a number nobody else can reproduce. Nothing on screen indicates that a filter silently stopped applying.
Folder Access
Before comparing 2 people’s results, confirm both can open the same report. Report and dashboard folder access is governed separately from record and field permissions, and it explains why so many of these conversations begin with 2 people describing 2 different reports. Access reviews of this kind sit inside a standard Salesforce health check and audit engagement.
Run A Controlled Comparison
When totals differ, freeze one version of the report and stop editing it. Send both users the same report URL, change no filter values between runs, and have both run it within the same hour.
If the totals still differ after that, the cause is visibility. Compare the 2 users on profile, permission sets, role assignment, and field access for every field used in a filter or a grouping.
How Salesforce Data Quality Corrupts A Correct Report
Everything above assumes the records themselves are sound. Often they aren’t, which produces the hardest version of this problem: a report that’s perfectly constructed, correctly permissioned, freshly refreshed, and still wrong about the business.
A correct SUM of bad opportunity amounts is still the wrong pipeline figure.
Data Condition | Reporting Consequence |
|---|---|
Duplicate opportunities | Pipeline and counts get overstated |
Blank required business fields | Records drop out of filtered groups |
Old open opportunities | Forecast and pipeline stay inflated |
Inconsistent picklist use | One category splits across several labels |
Deactivated owners | Records stay in reports but outside anyone’s follow-up |
Partial integration records | Counts rise while key fields stay empty |
Different definitions across teams | Similar-looking reports measure different populations |
Work tracked outside Salesforce | CRM reporting understates actual activity |
Stale Pipeline Is The One Everyone Avoids
Opportunities with close dates 4 months in the past, sitting in Negotiation, owned by someone who left in March. Every pipeline report includes them. Every forecast conversation works around them.
Nobody closes them out, because closing them out makes the number look worse. So the report stays accurate and the forecast stays fictional, and both conditions persist until someone with authority accepts a lower headline figure.
Measure Before Fixing
Cleanup projects fail when they start with cleanup. Establish a baseline first, so the improvement can be proven and re-run later. Completeness on open opportunities, duplicate rate across accounts and opportunities, the count of open records with close dates more than 30 days past, records owned by inactive users, distinct picklist values actually in use, and integration-created records with blank key fields give you a scorecard a leadership team will accept.
Those measures form the standing baseline for Salesforce data governance work, and they’re worth capturing before any records are changed.
Fix Entry At The Source
Cleanup without controls buys roughly 2 quarters before the same report goes wrong again.
That means validation rules on stage transitions, required business fields placed at the stage where the data actually exists, duplicate rules whose matching rules reflect how reps really type company names, ownership reassignment triggered by user deactivation, and a scheduled review that a named person owns. Records arriving from connected systems need the same treatment at the boundary, which is where ERP integration with Salesforce usually introduces its partial records.
Why Salesforce Dashboards Disagree With Their Own Reports
Salesforce Dashboards add 4 more ways for identical underlying data to tell 2 different stories, and all 4 are invisible to the person reading the screen.
The Dashboard Needs A Refresh
A dashboard displays results from its last run, not from this moment. Check the Last Refreshed timestamp before comparing any dashboard figure against a live report.
This causes more Monday morning disputes than anything else on this page, because a dashboard looks current. It has charts, and charts feel live even when the underlying query ran on Friday afternoon.
The Running User Changes Visibility
Dashboard components execute under the access of the configured running user, so every viewer sees that person’s record visibility rather than their own.
A rep can open a dashboard showing $8M of pipeline, click into the source report, and see $900K. Both numbers are correct, and the gap between them is entirely a permissions artifact.
A Dashboard Filter Is Still Applied
Dashboard filters persist in a viewer’s session. Someone who filtered to EMEA last Thursday can return on Monday, forget the filter is set, and quote the EMEA figure as the global one. Check the active filter before repeating any number that came off a dashboard.
Subscription Output Differs From The Browser
Dashboard subscription emails don’t carry dashboard filters. You can subscribe to a filtered dashboard and the email arrives unfiltered.
So the regional director reading the emailed dashboard and the regional director opening the filtered dashboard in a browser are comparing 2 genuinely different datasets under an identical title.
Failed refreshes surface here too. When the running user can’t execute one of the source reports, the refresh can fail while the dashboard continues displaying its last successful result. Catching that pattern early is routine work under Salesforce managed services and support.
When A Standard Report Can’t Answer The Question
Some reporting disputes have no fix inside report builder, because the question being asked isn’t one a standard report can answer. Rebuilding the report in these cases wastes a week and changes nothing.
Business Question | Suitable Method |
|---|---|
What is true in Salesforce right now? | Standard report |
How do 2 related record sets compare side by side? | Joined report |
How have selected fields changed recently? | Historical trend reporting |
What did the numbers look like at scheduled points in time? | Reporting snapshot |
What should leaders watch across several reports? | Dashboard |
Does the question span several systems or years of history? | Governed analytics or warehouse reporting |
A joined report is worth knowing about because it solves a narrow problem cleanly. It places 2 or more report blocks side by side under shared groupings, so open pipeline and closed-won can sit in one view without forcing both into a single report type.
Current State And Historical State Are Stored Differently
A Salesforce opportunity record holds its current field values. When a rep changes the amount from $200K to $140K, the record now says $140K and every report says $140K.
Run that pipeline report today and it returns today’s values on today’s open opportunities. Run it after 60 days of stage changes, amount edits, and close-date pushes, and there’s no way to reconstruct what the March board deck showed. The March values are gone from the record.
This is why pipeline numbers appear to change retroactively. The number did not change. The records did, and the report faithfully reflected them.
Retention Limits Are Narrower Than Expected
Historical methods each carry separate limits, and they aren’t interchangeable.
Historical Trending in Pipeline Inspection copies 3 months of historical data plus the current month when enabled, and stores that data for 12 months. An org that used opportunities for years before switching it on still only reaches back 3 months plus the current month. Field history for custom number and currency fields begins tracking the day those fields are enabled, never retroactively.
Standard Historical Trend Reporting carries its own limits on tracked objects, fields, and retained rows. Confirm the current documented limits for your edition before promising a leadership team 2 years of trend data.
Reporting snapshots work differently again. They write report results into a custom object on a schedule, so the history begins the day the snapshot is configured and lasts as long as the records are kept.
The practical rule: if a metric will ever be compared year over year, configure the historical method now. A history that was never captured can’t be backfilled, which is why long-range questions often move to a unified Data 360 layer instead.
What Untrusted Reporting Costs Your Team
Industry statistics aren’t much use here, because the cost is specific to your org and the inputs are sitting in your own calendar. The worksheet below can be filled in during an afternoon.
Cost Area | Calculation |
|---|---|
Reconciliation | Hours spent comparing conflicting reports × loaded labor cost |
Spreadsheet preparation | Manual reporting hours × frequency × loaded cost |
Report rework | Admin and analyst repair hours × loaded cost |
Data correction | Cleanup hours × loaded cost |
Meeting delay | Reporting debate minutes × attendee count × loaded cost |
Repeat support | Reporting tickets × average handling time × loaded cost |
Add the 6 rows together for an annual figure. Most teams find the meeting-delay row larger than expected once they time it honestly: take the minutes a recurring forecast call spends arguing about which number is right, multiply by attendees, then by the number of calls per year. Run that calculation with your own headcount and loaded rate before deciding the problem is too small to fix.
Keep decision losses in a separate list and keep them qualitative unless you hold evidence. Headcount approved against overstated pipeline, service staffing set from incomplete case reporting, marketing budget allocated on attribution that can’t be traced, and finance rebuilding sales numbers after every close all belong there. Estimating them invites an argument about the estimate instead of a fix for the reporting.
One pattern is worth watching for. Once a team stops trusting Salesforce Reports, they build a shadow spreadsheet. That spreadsheet becomes the working system of record, and the CRM investment quietly stops paying for itself while every license keeps renewing.
How To Run A Salesforce Reporting Trust Audit
Six passes, run in order, because each one rules out a layer and narrows what the next pass has to consider.
Pass One: Define The Metric
Before opening any report, write down the metric name, the owner by name rather than by team, the business meaning in one sentence, the included and excluded populations, the date basis, the currency treatment, and the system of record.
Roughly half of these audits end here, because 2 teams produce 2 different definitions and both reports were faithfully executing the definition they were given.
Pass Two: Inspect Report Construction
Check the report type, primary object, object relationships, row grain, filters, filter logic, formulas, and groupings against the definition from Pass One. Record what one row represents and write it at the top of the findings, because every later pass depends on that answer.
Pass Three: Test Visibility
Run the same saved report under 4 contexts: an administrator, a manager, a standard user, and the dashboard’s running user. Record 4 totals.
Where they differ in unexpected ways, the Salesforce Reporting Issues in front of you’re rooted in access rather than logic, and no amount of report rebuilding will resolve them.
Pass Four: Test Source Records
Sample the underlying data against the same measures used to establish the data quality baseline, so this pass produces numbers comparable to the ones captured before any cleanup began. Comparability matters more than precision here, since the point is to show movement quarter over quarter.
Pass Five: Test Freshness And History
Check the Last Refreshed timestamp, any active dashboard filters, subscription behavior, and whether the metric depends on historical tracking that was never configured. That last item is the one that can’t be fixed retroactively, so it deserves the most attention.
Pass Six: Reconcile A Controlled Sample
Pick 10 to 20 records whose correct treatment can be verified by hand and trace each one into the report. Confirm every record appears, appears exactly once, and contributes the amount expected.
Record each finding the same way, with the finding itself, its root cause, the affected reports, the business effect, the owner, the correction required, and the test that will prove the fix held. That final column matters more than it looks, because a fix without a test quietly reverts after the next release or permission change.
How To Keep Reports From Drifting Again

An audit produces a list. Turning that list into reports people still trust 18 months from now takes an operating model, and the model matters more than the individual fixes.
Give Every Metric A Named Owner
Build a metric dictionary where each entry holds the metric name, owner, calculation, included records, exclusions, date definition, currency treatment, and authoritative source.
One rule makes the dictionary work rather than decorate a wiki: a metric with no named owner doesn’t go in a board deck. Enforce that once and the dictionary maintains itself.
Validate Reports Under Real Permissions
Every corrected report should be tested under actual permission sets before it’s republished. A report that reconciles perfectly for an administrator and breaks for the sales team hasn’t been fixed, it has only been fixed for one person.
Reporting designed properly during Salesforce implementation services avoids most of this rework, since access models and report types get decided together rather than 2 years apart.
Control The Report Library
Report sprawl does more damage to trust than any single broken report, because it guarantees that 2 people searching for the same metric will find different reports.
Record the approved set, the folder owner, the naming convention, the report owner, the last review date, and the archive status. Archiving hundreds of stale reports usually improves reporting trust more than rebuilding a handful of good ones.
Put Reviews On A Calendar
Reporting drifts because organizations change faster than their reports do. A fixed cadence catches the drift before a board meeting does.
Cadence | Review |
|---|---|
Monthly | High-use dashboards and data quality exceptions |
Quarterly | KPI definitions and the approved report set |
Before major process changes | Report and dashboard dependencies |
After permission, field, stage, or integration changes | Regression check on affected reports |
That final row prevents the most frustrating version of this problem, where a report that reconciled cleanly in January breaks in February because somebody added a validation rule, renamed a picklist value, or adjusted a permission set. Orgs that expect heavy configuration change often pair this cadence with ongoing Salesforce consulting services so the regression check has an owner outside the admin queue.
Related VALiNTRY360 Case Studies
Reporting trust problems rarely stay contained to reports. They show up as manual data work, fragmented records across systems, and numbers that leadership has quietly stopped quoting. These 5 case studies cover engagements where those same underlying conditions were addressed.
Case Study | Why It Relates |
|---|---|
Manual data work fell from 500 hours a year to 4, the clearest illustration of what reconciliation labor actually costs | |
AdventHealth University: Salesforce Implementation For Higher Education | A 360 view of every alumnus, built by consolidating the scattered records that make single-source reporting impossible |
Reporting structured correctly at implementation rather than retrofitted after the numbers stopped agreeing | |
Average handle time cut by 7 minutes through case data complete enough to report on across 2 clouds | |
$500K in new revenue recorded in 3 months, with attribution traceable back to the campaigns that produced it |
FAQs About Salesforce Reports And Reporting Trust
Why do 2 Salesforce reports show different numbers?
Usually the report type, date field, or filter logic differs between them. Before comparing totals, export both report definitions and compare them field by field rather than visually, because a single Show Me setting or a nested OR condition can account for the entire gap.
Why do 2 users see different results from the same Salesforce report?
Record access differs between them. Ownership, role hierarchy, sharing rules, and territory assignment each filter the row set per user, so the same saved report legitimately returns different populations depending on who opens it.
How does a Salesforce report type affect the result?
It sets the primary object and the related objects reachable through defined relationships, which determines eligibility before filtering. Changing a report type on an existing report isn’t a cosmetic edit, so clone the report and compare row counts before replacing the original.
Why are records missing from my Salesforce report?
Check the report type and its required relationships, then the reporting timeframe, then filter criteria, then the running user’s access. Adding a column from a child object is a frequent overlooked cause, since it can drop every row without a related record.
Why is Salesforce Record Count higher than the number of Accounts or Opportunities?
Record Count totals report rows rather than business entities. To get the figure you actually want, group by the parent record and read the group count, or add a Power of One formula field that sums to 1 per unique parent.
Can Salesforce permissions change report totals?
Yes, at 2 separate layers. Record-level sharing changes which rows appear, while field-level security can invalidate filter logic referencing a field the viewer can’t read, which silently widens the result instead of narrowing it.
How does a dashboard running user affect Salesforce dashboards?
Components execute under the running user’s access rather than the viewer’s. When a dashboard must reflect each viewer’s own data, configure it to run as the logged-in user and confirm every source report works under the narrowest profile that will open it.
Why does a Salesforce dashboard show old data?
Dashboards display their last successful run. Beyond checking the Last Refreshed timestamp, verify that the running user can still execute every source report, because a refresh can fail while the dashboard keeps showing its previous result.
Do dashboard filters apply to Salesforce subscription emails?
No. Filters are never applied to emailed dashboards, so the recipient sees unfiltered data. Where a filtered view matters to a specific audience, build a separate dashboard with the filter values hard-coded into its source reports.
Can duplicate records make Salesforce reports inaccurate?
Yes, and the damage compounds because duplicates inflate counts and summed amounts simultaneously. Measure the duplicate rate before cleanup starts so the improvement is provable rather than asserted.
How do blank fields affect Salesforce reporting?
Records with blank values fall out of filtered groups and vanish from categorized views. Formulas also treat blank cells as zero, so an average across partially complete data is calculated against a denominator no one chose.
Can changing an opportunity’s Close Date change its reported amount?
In multi-currency orgs, yes. Converted amounts are calculated using the specified Close Date, so shifting that date into a different exchange-rate period alters the converted figure without anyone editing the deal value.
Why can’t a current Salesforce report reproduce an older pipeline number?
Opportunity records store current field values only. Reconstructing an older figure requires field history, historical trending, or a reporting snapshot that was already running at the time, none of which can be applied retroactively.
How often should Salesforce reports and dashboards be audited?
Monthly for high-use dashboards and data quality exceptions, quarterly for KPI definitions and the approved report set, plus a regression check triggered by any permission, field, stage, or integration change.
When should a company use reporting snapshots or historical trending?
Historical trending suits recent changes on a limited set of tracked fields, while snapshots suit scheduled capture of full report results into a custom object. Snapshots carry no built-in retention ceiling, which makes them the better choice for multi-year comparisons.
Related Posts
- Salesforce Consulting Services
Why Salesforce Integrations Fail – and How to…
Introduction: When an Integration Stays Online but the Business Process Breaks A Salesforce integration can pass every technical check and still fail the business that depends on it. The connection authenticates and the API returns success, while records still arrive…
- Salesforce Consulting Services
How to Fix a Failed Salesforce Implementation Without…
Your Salesforce org probably already holds customer history, working automation, integrations, reports, custom code, and months of project effort. That’s exactly why a troubled implementation deserves a recovery decision based on evidence, not a reflex to tear it down.A Salesforce…
- Salesforce Consulting Services
Salesforce Consulting RFP Template & Partner Scorecard
Ask 2 Salesforce firms to quote the same project and you can get 2 very different prices back. One assumed a lighter data migration. Another built in more testing, more training, or a longer support period.Neither one lied. They filled…